Map archived by the National Library of Australia
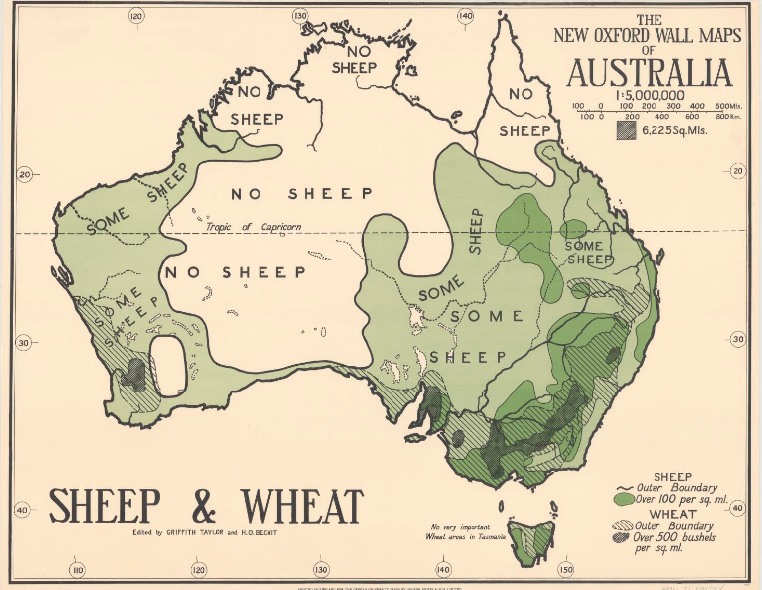
This fascinating 1920 map from The New Oxford Wall Maps reveals something that might surprise modern readers: vast stretches of Australia where sheep farming simply wasn’t viable.
The stark “NO SHEEP” labels sprawled across the continent’s interior tell a story of environmental limits that even the most determined graziers couldn’t overcome.
The Green Corridors of Prosperity
Look closely at the shaded regions hugging the coasts, and you’ll spot where Australia’s wool wealth was actually concentrated.
The southeastern corner, southwestern tip, and scattered pockets along the eastern seaboard glow green with prosperity. These weren’t random choices. Rainfall, pasture quality, and access to ports made these areas ideal for both sheep grazing and wheat cultivation.
The densest green areas, marked as producing over 500 bushels of wheat per square mile, overlay perfectly with regions supporting substantial sheep populations. This wasn’t a coincidence. Mixed farming operations allowed landholders to diversify risk and maximize land use in areas blessed with adequate rainfall.
The Harsh Reality of the Interior
That enormous beige expanse labeled “NO SHEEP” wasn’t empty land waiting to be conquered. It represented Australia’s arid and semi-arid interior where rainfall was too sparse and unpredictable to sustain large flocks.
The Tropic of Capricorn cuts right through this region, and the notation hints at the challenging conditions that persist there.
Even the areas marked “SOME SHEEP” required careful management and often disappointed farmers who pushed too far inland during wet years, only to face devastating losses when droughts returned.
Reading Between the Boundary Lines
The map uses brilliant visual language to communicate agricultural intensity.
The sheep boundary lines show where viable grazing transitions to marginal country. Meanwhile, wheat cultivation patterns reveal where rainfall and soil conditions aligned perfectly for cereal crops.
Notice how Tasmania appears as a small inset with substantial sheep coverage. The island’s temperate climate and reliable rainfall made it sheep country through and through, even if its wheat production couldn’t match mainland operations.
What This Tells Us About 1920s Australia
This map captures Australia at a pivotal moment. Post-World War I, the nation was pushing agricultural expansion to its environmental limits. Returned soldiers were being settled on land, and there was enormous pressure to increase production.
Yet this map served as a reality check, showing administrators and would-be farmers exactly where nature drew the line.
The cartographers at Oxford understood something crucial: accurate information about environmental constraints could save fortunes and heartbreak. By clearly marking where sheep farming was impossible, they provided invaluable guidance during an era of agricultural optimism.
The Legacy Lives On
Modern Australia’s agricultural zones haven’t changed dramatically from what this century-old map depicts.
The same coastal and near-coastal regions remain productive, while the interior stays largely devoted to cattle stations, mining, or conservation. Sometimes the old maps know best.
Help us out by sharing this map: