Map from Princeton University Science & Global Security
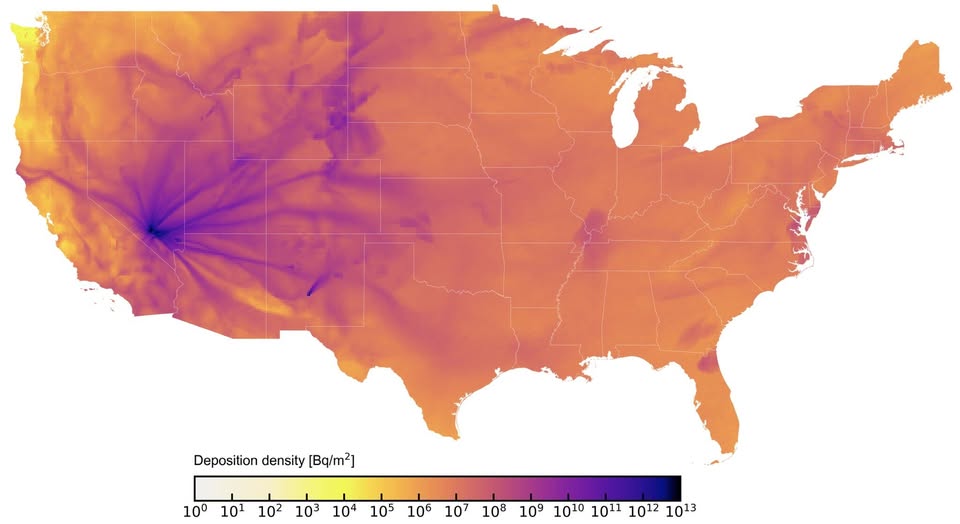
Most maps of the United States show highways, population centers, or weather patterns. This one shows something far more unsettling: the lasting radioactive signature left behind by decades of nuclear weapons testing, measured in becquerels per square meter (Bq/m²).
That deep purple starburst pattern centered in the Nevada desert is not a glitch. It is ground zero, quite literally, for the United States’ atmospheric nuclear testing program that ran from the late 1940s through the early 1960s.
What Are We Actually Looking At?
The color scale here is logarithmic, meaning each step represents a tenfold increase in deposition density.
The darkest purple regions near the Nevada Test Site recorded deposition levels approaching 10¹² to 10¹³ Bq/m², while the warm orange tones blanketing most of the eastern United States sit in the 10⁹ to 10¹¹ range. That still sounds high, and it is, but context matters enormously when discussing radioactivity.
The radioisotopes being mapped are primarily cesium-137 and strontium-90, long-lived fission products that settled into soil and vegetation after being lofted into the atmosphere during above-ground detonations.
Why Does the East Look So Uniform?
Prevailing winds in the United States blow predominantly west to east. Fallout released over Nevada was carried aloft and distributed broadly across the continent, explaining the relatively even orange wash across the Midwest and East Coast.
The streaking lines radiating outward from Nevada reflect specific wind patterns during individual test events, each blast leaving its own directional signature baked into the soil.
Should You Be Worried Today?
Honestly? Probably not in any immediate sense.
The levels shown represent cumulative historical deposition, not current dose rates. Much of the cesium-137 has decayed significantly since testing ended (its half-life is about 30 years), and what remains is largely bound up in soil rather than actively entering food chains at dangerous concentrations.
That said, researchers continue to study elevated cancer rates in downwind communities, particularly in Utah, Nevada, and Arizona. “Downwinders,” as they became known, bore a disproportionate health burden that the US government formally acknowledged through the Radiation Exposure Compensation Act.
The Bigger Picture
This map is a striking reminder that large-scale environmental contamination does not respect borders, politics, or property lines. What happened in the Nevada desert between 1951 and 1962 became, quite literally, everyone’s problem. Over 100 above-ground tests deposited their signatures into American soil permanently.
It is history you can measure with a Geiger counter.
Help us out by sharing this map: