Map by Reddit user caliball_1850
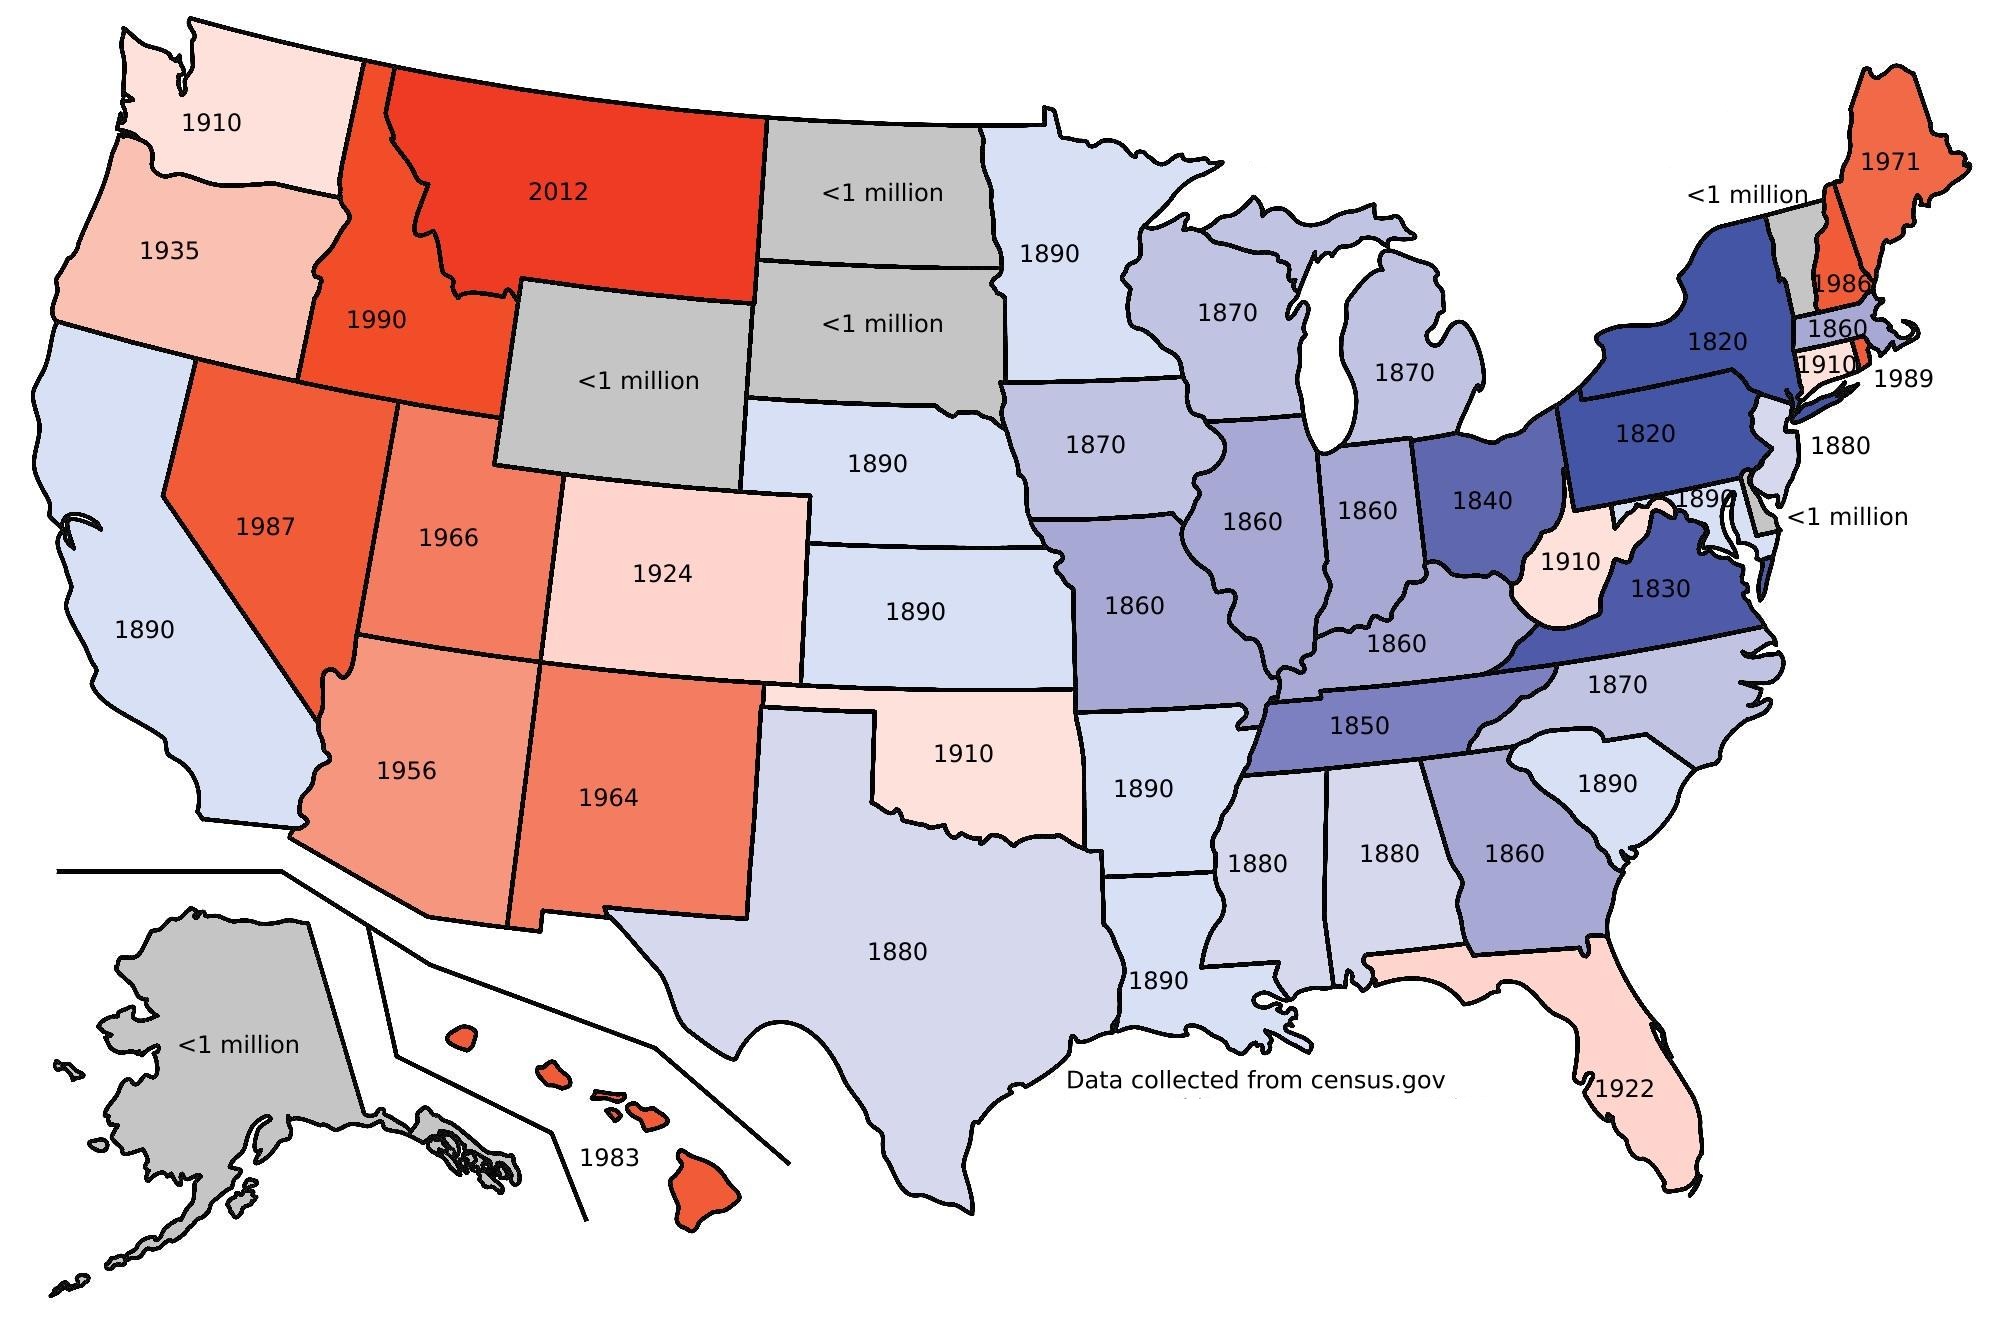
Looking at this fascinating map, it’s clear that America’s population story begins in the East.
New York reached the million-person milestone way back in 1820, making it the first state to join this exclusive club. Pennsylvania followed suit, and by 1860, Ohio (and a few other Eastern states) had crossed the threshold too.
These early adopters benefited from being original colonies or gateway states, where immigrants first stepped onto American soil and industries took root.
The South’s Steady Climb
The southern states show an interesting pattern of growth throughout the 1800s. Virginia, Georgia, Alabama, and several others all hit their million-person marks between 1850 and 1890.
This growth coincided with the expansion of cotton agriculture and the post-Civil War Reconstruction era. Texas, despite its enormous size, didn’t reach a million residents until 1880, proving that land area doesn’t automatically translate to population density.
The West’s Explosive 20th Century Growth
Here’s where things get really interesting. The Western states exploded onto the population scene much later, but often more dramatically.
California didn’t hit a million until 1890, yet it’s now the most populous state in the nation. Arizona waited until 1956, Nevada until 1987, and Montana crossed this threshold in 2012.
The pattern tells a story of westward expansion, the impact of air conditioning making desert living tolerable, and the rise of industries like entertainment, technology, and tourism that drew people away from traditional population centers.
The Holdouts
Several states marked as having populations under one million remind us that America’s geography is diverse.
Alaska’s vast wilderness and Wyoming’s wide-open spaces simply can’t support dense populations the way coastal or central states can.
These areas serve different purposes in our national landscape, offering natural resources, agricultural land, and breathing room that crowded states can’t provide.
What This Means Today
This map isn’t just about history. It shows us how economic opportunities, climate, natural resources, and human innovation shape where we choose to live. The states that reached a million people earliest built infrastructure and institutions that continue to attract residents. Meanwhile, newer growth states are still figuring out how to manage rapid expansion.
Understanding when states hit major population milestones helps us appreciate the dynamic nature of American growth and reminds us that the map of where Americans live continues to evolve with each passing decade.
Help us out by sharing this map: