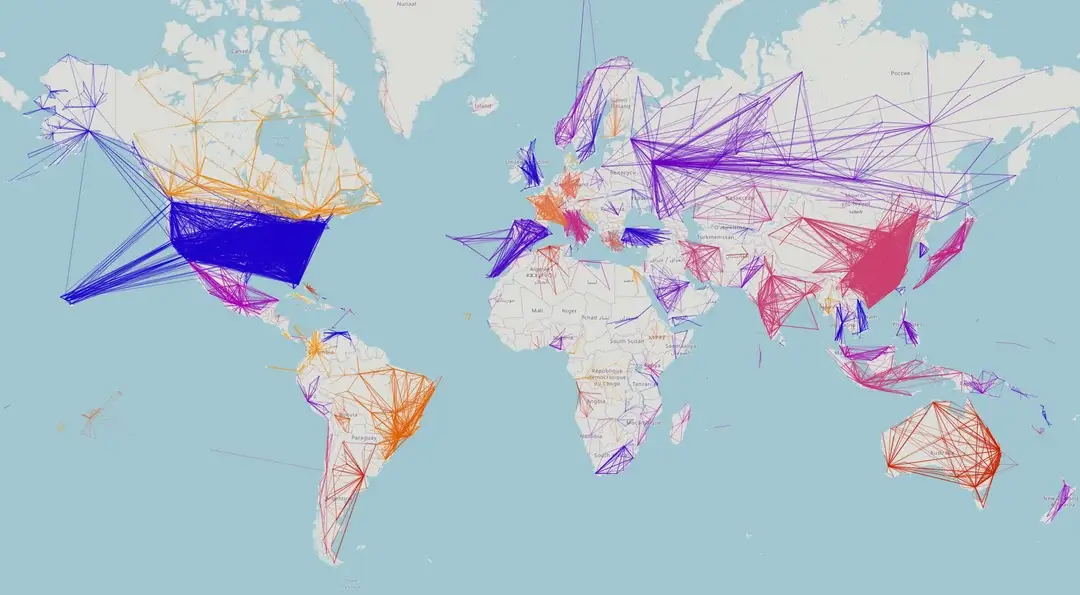
Map by Reddit user phaj19
The map above reveals a fascinating pattern when you strip away all international routes and focus solely on domestic flights within individual countries.
What immediately stands out is the stark contrast between different regions. While some countries are crisscrossed with dense networks of internal flight routes, others appear virtually empty of domestic air traffic.
The Domestic Flight Giants
The United States and China dominate domestic aviation. According to OAG data, the US leads with 76.8 million domestic seats in February 2025, followed by China with 71.2 million seats.
This makes sense given their vast territories and economic development. Both nations have distances that make domestic flying often necessary rather than just convenient.
Why Some Countries Fly More Than Others
Several factors determine domestic air travel patterns:
- Size and Geography: Large countries with significant distances between major cities naturally develop robust domestic networks. It’s impractical to drive from New York to Los Angeles or Beijing to Guangzhou.
- Economic Development: Wealthier nations have populations that can afford air travel and businesses requiring frequent domestic trips.
- Infrastructure Alternatives: Countries with excellent high-speed rail networks, like many in Europe, see less domestic air traffic. Why fly when a fast train works?
- Population Distribution: Nations with multiple large cities spread across their territory have more domestic routes than those with one dominant city.
Asian Dominance
Asia features prominently in domestic aviation rankings.
India ranks third globally with 14.7 million domestic seats, while Japan follows with 11.1 million. Indonesia provides 8.0 million domestic seats, essential for connecting its many islands.
The African Gap
The most striking feature is how sparse routes appear across Africa.
This reflects lower average incomes, less developed aviation infrastructure, and many countries having one dominant city rather than multiple major metropolitan areas.
Surprising Facts
Australia ranks seventh globally with 6.2 million domestic seats despite its small population – vast distances between Sydney, Melbourne, Perth, and Brisbane drive this demand.
Spain’s 4.1 million domestic seats might seem surprising for a European country, but its island territories create natural demand for flights that can’t use land transport.
Brazil and Mexico, with 9.2 million and 5.2 million seats respectively, reflect Latin America’s continental scale and growing economies.
Looking Forward
The domestic flight landscape continues evolving as countries develop economically. While North America and Europe currently dominate, future growth is predicted to be highest in Asian markets.
This map tells a story of economic development, geography, and mobility patterns – it’s a visualization of how different parts of the world connect internally and move people across vast distances.
Help us out by sharing this map:
You May Also Like:
The Ancient Highways That Built the Modern World: The Silk Road Explained

The Surname Map: How England and Wales Divided by Family Names in 1881
Where Are South America's Indigenous Peoples Today? (The Numbers Might Surprise You)
The Three Faces of Istanbul: Understanding Constantinople, the City, and the Greater Metropolitan Ar...
How Paper Conquered the World: The Remarkable Journey from Ancient China to Your Desk
The Most Ambitious Map Ever Drawn: Meet the 1587 Masterpiece That Blew Everyone's Minds

Kiribati: The Only Nation That Exists in All Four Hemispheres